winplot
Windowed plot.
Syntax
winplot(x)
winplot(x,w,ws)
winplot(x,w,ws,flag)
y=winplot(x,'parm')
Description
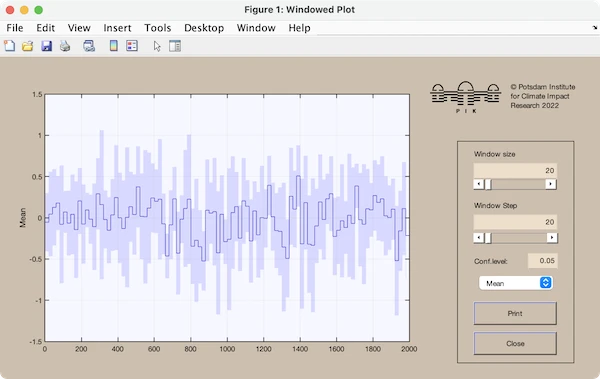
winplot(x [,w,ws]) plots means or variances of the sub-vectors of vector x, which have the length w and are shifted by the step ws. x can be a two-column vector, where the first column would be the time-scale.
winplot without any arguments calls a demo (the same as the example below).
Parameters
The optional parameter flag can determine the kind of the result, where flag can be either a string or a scalar:| 'mean' or 1 | - | Mean (1st moment). |
| 'var' or 2 | - | Variance (2nd moment). |
| 'std' or 3 | - | Standard deviation. |
| 'median' or 4 | - | Median. |
| 'sqm' or 5 | - | Squared Mean. |
| 'geo' or 6 | - | Geometric Mean. |
| '3rd' or 7 | - | 3rd moment. |
| 'skw' or 8 | - | Skewness. |
| 'kur' or 9 | - | Kurtosis. |
Example
winplot(randn(2000,1),20,20)