taucrp
Creates a close returns plot.
Syntax
r=taucrp(x)
r=taucrp(x,m,t,e,w)
r=taucrp(x,y,m,t,e,w)
r=taucrp(x,y,m,t,e,w,'param')
Description
r=taucrp(x [,y] [,param1,param2,...]) creates a cross recurrence plot/ recurrence plot r for a limited range of past and future states, also known as close returns plot.
r=taucrp(x,m,t,e,w) uses the dimension m, delay t, the size of neighbourhood e and the range w of past and future time steps.
If x and y are multi-column vectors then they will be considered as phase space vectors (taucrp can be used for real phase space vectors without embedding).
Parameters
Dimension M, delay T, the size of neighbourhood E and the range W are the first four numbers after the data series; further parameters can be used to switch between various methods of finding the neighbours of the phasespace trajectory and to suppress the normalization of the data.
| Methods of finding the neighbours/ of plot. | ||
| 'maxnorm' | - | Maximum norm. |
| 'euclidean' | - | Euclidean norm. |
| 'minnorm' | - | Minimum norm. |
| 'rr' | - | Maximum norm, fixed recurrence rate. |
| 'fan' | - | Fixed amount of nearest neighbours. |
| 'distance' | - | Distance coded matrix (global CRP, Euclidean norm). |
Normalization of the data series. | ||
| 'normalize' | - | Normalization of the data. |
| 'nonormalize' | - | No normalization of the data. |
Parameters not needed to specify.
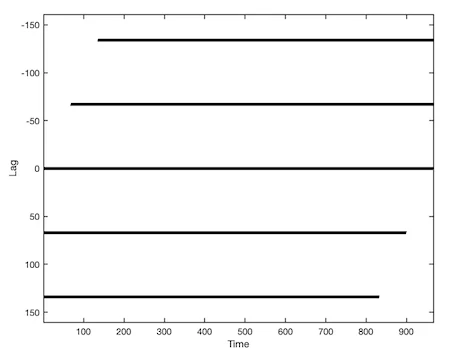
Examples
a = sin((1:1000) * 2 * pi/67);
w = 160;
X = taucrp(a,2,17,0.2,w,'nonorm','euclidean');
imagesc(1:size(X,2),-w:w,X), colormap([1 1 1; 0 0 0])
xlabel('Time'), ylabel('Lag')
See Also
crp, crp2, crp_big, jrp, crqaReferences
Marwan, N., Romano, M. C., Thiel, M., Kurths, J.: Recurrence Plots for the Analysis of Complex Systems, Physics Reports, 438(5-6), 2007.