crqa
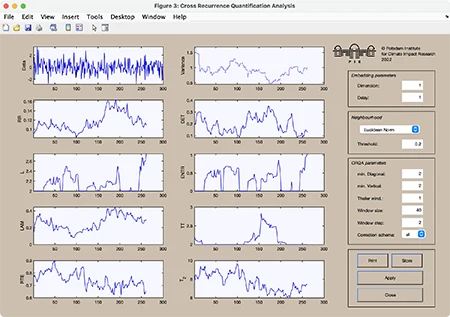
Computes and plots the CRQA measures.
Syntax
crqa(x)
crqa(x,y)
y=crqa(x,y,m,t,e,w,ws)
y=crqa(x,y,m,t,e,w,ws,lmin,vmin)
y=crqa(x,y,m,t,e,w,ws,lmin,vmin,tw)
y=crqa(x,y,m,t,e,[],'param1','param2',...)
Description
Recurrence quantification analysis of cross-recurrence with the first vector x and the second y. The results can be plotted.
The input vectors can be multi-column vectors, where each column will be used as a component of the phase-space vector. However, if the first column is monotonically increasing, it will be used as an time scale for plotting.
Parameters
Dimension m (default 1), delay t (default 1), the size of neighbourhood e (default 0.1), the window size w (default w=[]) and the shift value ws (default 1) are the first five numbers after the data series; if w=[] then the whole plot will be calculated. The minimal length of diagonal and vertical structures can be specified with lmin and vmin respectively (default is 2).
As the last numeric parameter, the size of the Theiler window tw can be specified (default is 1). This window excludes the recurrence points parallel to the main diagonal from the analysis. The application of the Theiler window is useful only for recurrence plots. In cross recurrence plots, the size of the Theiler window will be set automatically to zero.
Further parameters can be used to switch between various methods of finding the neighbours of the phasespace trajectory, to suppress the normalization of the data, to apply a correction schema for border lines, and to suppress the GUI (useful in order to use this programme by other programmes).
| Methods of finding the neighbours. | ||
| 'maxnorm' | - | Maximum norm (default). |
| 'euclidean' | - | Euclidean norm. |
| 'minnorm' | - | Minimum norm. |
| 'nrmnorm' | - | Euclidean norm between normalized vectors (all vectors have the length one). |
| 'rr' | - | Maximum norm, fixed recurrence rate. |
| 'fan' | - | Fixed amount of nearest neighbours. |
| 'inter' | - | Interdependent neighbours. |
| 'omatrix' | - | Order matrix. |
| 'opattern' | - | Order patterns recurrence plot. |
Normalization of the data series. | ||
| 'normalize' | - | Normalization of the data (default). |
| 'nonormalize' | - | No normalization of the data. |
Methods regarding considering border lines. | ||
| 'all' | - | Considers all individual lengths of border lines (default). |
| 'censi' | - | Correction schema for border lines as proposed by Censi et al. 2004, in which the length of the longest border line is used for all border lines (recommended for cyclical signals). |
| 'kelo' | - | Correction schema for border lines using KEep LOngest diagonal line (KELO), in which only the longest border line (in each triangle) of the RP is considered but all other border lines are discarded. |
Suppressing the GUI. | ||
| 'gui' | - | Creates the GUI and the output plot (default). |
| 'nogui' | - | Suppresses the GUI and the output plot. |
| 'silent' | - | Suppresses all output. |
Output | ||
| y(:,1) | - | Recurrence rate. |
| y(:,2) | - | Determinism. |
| y(:,3) | - | Averaged diagonal length. |
| y(:,4) | - | Length of the longest diagonal line. |
| y(:,5) | - | Entropy of diagonal length. |
| y(:,6) | - | Laminarity. |
| y(:,7) | - | Trapping time. |
| y(:,8) | - | Length of the longest vertical line. |
| y(:,9) | - | Recurrence time of 1st type. |
| y(:,10) | - | Recurrence time of 2nd type. |
| y(:,11) | - | Recurrence period density entropy. |
| y(:,12) | - | Clustering coefficient. |
| y(:,13) | - | Transitivity. |
Parameters are optional and not required.
The window of length w is applied on the data and not on the RP, i.e. the RP will have smaller size than the window, thus w-(m-1)*tau. If we consider the data window at time i ... i+w, the corresponding RQA measures are assigned to time i. Therefore, if you see a beginning of a transition in the plot of the RQA measures at time i, this transition will probably happen at time i+w-(m-1)*tau.
Limitations
For higher speed in output the whole matrix of the recurrence plot is in the work space - this limits the application of long data series. However, a solution for using long data series you can find under the description for crp.
Warning
The RQA measures may differ from those of the RQA programmes by Charles Webber Jr. For compatibility use a Theiler window of size one and ensure that the data are normalized before by the same distance which is used in the RQA programmes; e.g. normalize with the maximal phase space diameter, which can be estimated with the programme pss:
RQA=crqa(100*x/pss(x,dim,lag,'euclidean'),dim,lag,e,[],[],l_min,v_min,1,...
        'euclidean','nonormalize','silent')
Examples
rng(0); a=randn(300,1);
crqa(a,1,1,.2,40,2,'euc')
N=300; w=40; ws=2;
a=3.4:.6/(N-1):4;
b=.5; for i=2:N, b(i)=a(i)*b(i-1)*(1-b(i-1));end
y=crqa(b,3,2,.1,w,ws);
subplot(2,1,1), plot(a,b,'.','markersize',.1)
title('logistic map'), axis([3.4 4 0 1])
subplot(2,1,2), plot(a(1:ws:N-w),y(1:ws:N-w,1))
ylabel('recurrence rate'), axis([3.4 4 0 1])
See Also
References
Marwan, N., Romano, M. C., Thiel, M., Kurths, J.: Recurrence Plots for the Analysis of Complex Systems, Phys. Rep., 438, 2007.
Little, M., McSharry, P., Roberts, S., Costello, D., Moroz, I.: Exploiting Nonlinear Recurrence and Fractal Scaling Properties for Voice Disorder Detection, Biomed. Eng. Online, 6, 2007.
Marwan, N., Donges, J. F., Zou, Y., Donner, R. V., Kurths, J.: Complex network approach for recurrence analysis of time series, Phys. Lett. A, 373(46), 2009.
Kraemer, K. H., Marwan, N.: Border effect corrections for diagonal line based recurrence quantification analysis measures, Phys. Lett. A, 383, 2019.
 © N. Marwan, 2024
Potsdam Institute for Climate Impact Research
Dept. Complexity Science
Imprint | Privacy policy | Accessibility statement