crp2
Creates a cross recurrence plot/ recurrence plot and computes the line of synchronization.
Syntax
crp2(x)
crp2(x,y)
crp2(x,m,t,e)
r=crp2(x,[],m,t,e)
r=crp2(x,m,t,e,'param1','param2',...)
r=crp2(x,y,m,'param1')
Description
Creates a cross recurrence plot/ recurrence plot from the embedding vectors x and y. Results can be stored into the workspace. Further it is possible to estimate the line of synchronization (LOS) in order to get the nonparametric time-relationship between the two considered systems.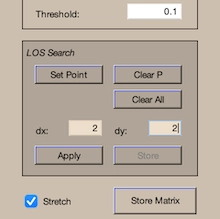
Allows to change the parameters interactively by using a GUI.
The embedding dimension m is given by the size of the n x m matrix x and y; if the matrix y is not specified, a simple (auto) recurrence plot is created.
Parameters
Additionally dimension m (default 1), delay t (default 1) and the size of neighbourhood e (default 0.1) are the first three numbers after the data series; further parameters can be used to switch between various methods of finding the neighbours of the phasespace trajectory, to suppress the normalization of the data and to suppress the GUI (useful in order to use this programme by other programmes).| Methods of finding the neighbours. | ||
| 'maxnorm' | - | Maximum norm (default). |
| 'euclidean' | - | Euclidean norm. |
| 'minnorm' | - | Minimum norm. |
| 'nrmnorm' | - | Euclidean norm between normalized vectors (all vectors have the length one). |
| 'rr' | - | Maximum norm, fixed recurrence rate. |
| 'fan' | - | Fixed amount of nearest neighbours. |
| 'omatrix' | - | Order matrix (disabled). |
| 'opattern' | - | Order patterns recurrence plot. |
| 'distance' | - | Distance coded matrix (global CRP, Euclidean norm). |
Normalization of the data series. | ||
| 'normalize' | - | Normalization of the data (default). |
| 'nonormalize' | - | No normalization of the data. |
Suppressing the GUI. | ||
| 'gui' | - | Creates the GUI and the output plot (default). |
| 'nogui' | - | Suppresses the GUI and the output plot. |
| 'silent' | - | Suppresses all output. |
Parameters are optional and not required.
Limitations
For higher speed in output the whole matrix of the recurrence plot is in the work space - this limits the application of long data series. However, a solution for using long data series you can find under the description for crp.
Examples
% pendulum's location vector:
a=sin((1:1000)*2*pi/200);
% pendulum's velocity vector:
b=cos((1:1000)*2*pi/200);
crp2(a(1:500),b(1:500),'nonorm','euclidean')
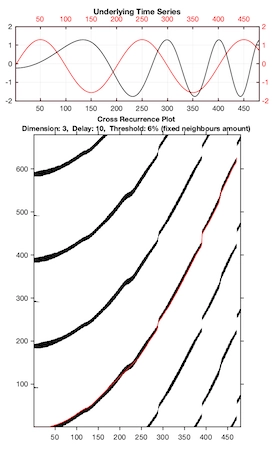
b=sin(.01*([1:1000]*2*pi/67).^2);
crp2(b(1:500),a(1:700),3,10,.06,'fan')
See Also
crp, crp_big, trackplotReferences
Marwan, N., Thiel, M., Nowaczyk, N.: Cross Recurrence Plot Based Synchronization of Time Series, Nonlin. Proc. Geophys. 9, 2002.