corrgram
Calculate windowed cross correlation between two signals.
Syntax
c = corrgram(a,b,maxlag,window,noverlap,method)
[c,l,t] = corrgram(...)
c = corrgram(a,b)
corrgram(a,b)
Description
c = corrgram(a,b,maxlag,window,noverlap) calculates the windowed cross correlation between the signals in vector a and vector b. corrgram splits the signals into overlapping segments and forms the columns of c with their cross correlation values up to maximum lag specified by scalar maxlag. Each column of c contains the cross correlation function between the short-term, time-localized signals a and b. Time increases linearly across the columns of c, from left to right. Lag increases linearly down the rows, starting at -maxlag. If lengths of a and b differ, the shorter signal is filled with zeros. If n is the length of the signals, c is a matrix with 2*maxlag+1 rows and k = fix((n-noverlap)/(window-noverlap)) columns.
c = corrgram(...,method) using either Pearson correlation ('pearson', default), Spearman's rank correlation ('spearman'), or Kendall's Tau ('kendall').
[c,l,t] = corrgram(...) returns a column of lag L and one of time T at which the correlation coefficients are computed. L has length equal to the number of rows of c, T has length k.
c = corrgram(a,b) calculates windowed cross correlation using defeault settings; the defeaults are maxlag = floor(0.1n), window = floor(0.1*n) and noverlap = 0. You can tell corrgram to use the defeault for any parameter by leaving it off or using [] for that parameter, e.g. corrgram(a,b,[],1000).
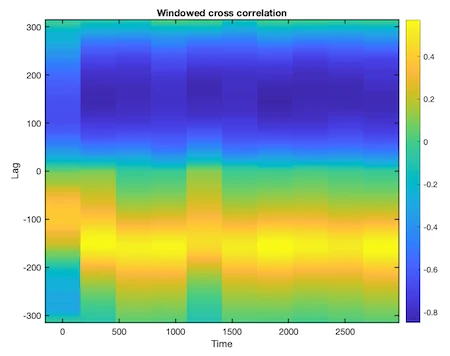
corrgram(a,b) with no output arguments plots the windowed cross correlation using the current figure.
Examples
x = cos(0:.01:10*pi)';
y = sin(0:.01:10*pi)' + .5 * randn(length(x),1);
corrgram(x,y)
See Also
corrcoeff,
corr,
xcorr,
migram